
If you are having problems with your PC or just want to check out how well your cooling is doing then this guide will help you. Overheating is a common PC problem and can be caused by many different things from a simple build up of dust, a loose cooler, fans not working or a component drawing too much voltage will cause the heat in your system to rise and as a result your PC's performance to suffer. Common symptoms are your computer is shutting itself down and not immediately switching back on or games appear to be stuttering.
The two common parts of a gaming PC that get hot are the CPU (processor) and Graphics card (GPU), thankfully its really easy to gain access to view their temperature at any given moment.
The BIOS/UEFI
The BIOS (Basic Input Output System) is the software built into the hardware. This is very basic and completely different to operating system software like Microsoft Windows. Like the name suggests it is very basic and really only allows you to control/monitor the hardware that the BIOS is installed to. In 2011 UEFI became mainstream to consumer hardware in the form of the Intel P67 motherboard chip set (6th Series). In short UEFI is the same as a BIOS but brings more features and pretty menus to the table, and for the purpose of this guide serves the same result if you are using a BIOS or UEFI. Given that a UEFI is relatively new in the computer world it is still often referred to as the BIOS, we still call it a BIOS and I suspect many other will for years to come.
In order to check the temperatures of components in your system you can firstly try the motherboard BIOS. The Motherboard BIOS is the most powerful BIOS that any of your hardware will have and will tell you temperatures of your processor and often more such as the motherboard, hard drives and other components depending on the model of motherboard you have. Using the BIOS is the quickest way to check and is very accurate as you don't need to download and install anything as its already there.
To enter the BIOS, restart your PC simply push the delete key when you see the motherboard manufacturer splash screen - You should now see the BIOS. Different models and brands of motherboards are all different but generally UEFI motherboards will immediately display the information you are after as soon as you enter the UEFI - you looking for something along the lines of CPU information/CPU temperature. For example current Asus motherboards show this information on the left hand side under ‘cpu information’ as soon as you enter the BIOS which will tell you the current voltage and temperature of your processor. Of course it is impossible to list exactly where and how to access these temperatures on every single make and model of motherboard so you may need to look in a couple of sub-menus for the 'CPU information' menu - Your motherboard manual will describe exactly where this menu is so if you can't find it refer to the manual.
Once you have found your temperature keep an eye on it for 15 minutes or so, especially if your computer has been switched off for a while as it may take a little time for the processor to 'warm up'. Taking the CPU temperature after a period of 15 minutes is a more accurate reading than the temperature you may first find. The downside of this method is it will normally only show you the CPU temperature and not other components and will only give you a temperature when the processor is in its idle state and not doing much work - when a processor has to do some work then they get much hotter but this test will usually spot a CPU temperature that is massively out from where it should be usually due to a failed or loose processor cooler.
Software CPU Temperature
The other route to check temperatures is using software that works under your operating system. It doesn't require a reboot and is used universally but you have to take the time to download it.
CoreTemp
CoreTemp is probably the best and most accurate way to give you a custom built PC CPU temperature. You can get the 64bit standalone installer here here or if you want another version or that link as expired then have a look here. Once ciore temp is downloaded run/install and run it and you will be presented with something that looks like this;
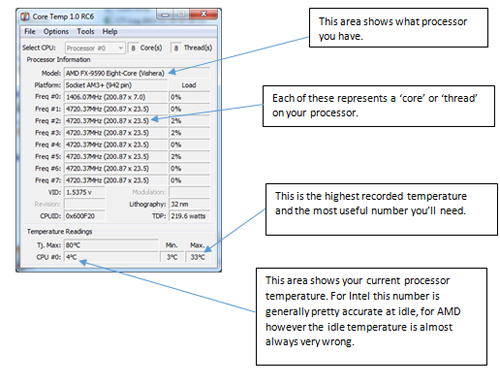
Leave it running 15 minutes and make a note of your max CPU temperature. This is another 'idle' temperature - The processor is not being worked hard and therefore is probably not getting very hot. Most overheating issues come as a result of running an application or game so by all means go ahead and and try and use your programs and games to replicate the issue you were having (if any). The tools menus has the option to turn on logging which will log the temperatures in a *.txt file where CoreTemp is installed/being run from so if you fire up a game you are no longer going to see a real time CoreTemp display and may find the log handy to refer to if your PC shuts down before you get the chance to ALT & TAB back to CoreTemp before your PC shuts down.
Prime95
Logging temperatures and running games can be a bit awkward so it maybe best to artificiality give the CPU some work to do. This can be done with a program called Prime95 and we use it here to test our gaming computer overclocks. It works by asking the CPU to calculate prime numbers - ruining it for a second or two and it would have calculated thousands of them! Download the 64bit version directly here or visit the download page here. Once downloaded, run it and you will end up with a welcome screen that looks like this:
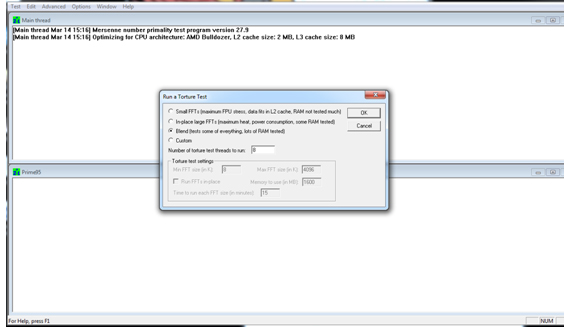
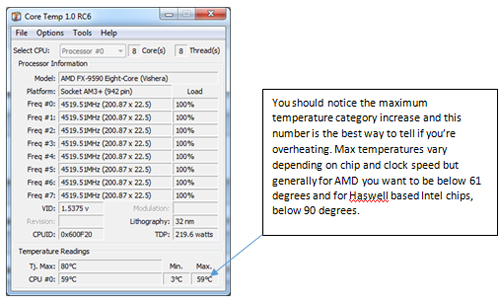
Select Small FFT’s and click OK. Prime 95 will start working out its prime numbers and CoreTemp should then begin to reflect the heat generated by the CPU working hard. Please be aware that Prime95 will work a CPU harder than any other real world application or game so the temperature increase will be significant and take the CPU temperature close to its max. After 10 minutes the real time temperature should be accurate to record or even the max temperature.
Software Graphics card Temperature
To check the temperature of the graphics card you will need a program called Furmark which you can get here. Just be careful with the download buttons as they do display adverts on the download pages. Once downloaded, run it and you will see something like this;
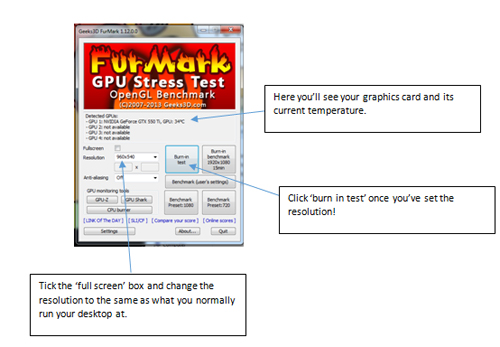
Tick the full screen box and select your resolution you run and then finally click the burn in test. The magic will start and you will be presented with what can only be described as a spinning furry donut like this;
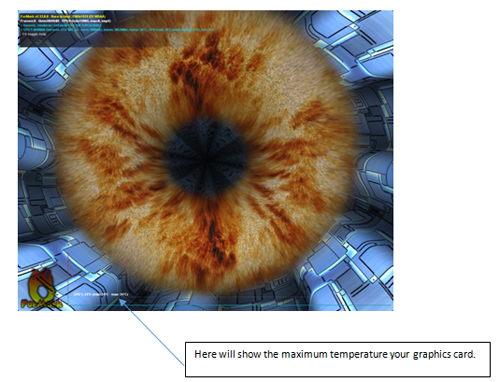
The interesting bit is at the bottom of the page - there is a real time temperature graph displaying the temperature of your graphics card and as time goes on this temperature will increase. The very start of the test will show your cards idle temperature but after around 10 minutes the graphics card temperature will peek and then would be a good time to record the temperature. Again like Prime95 Furmark will stress your graphics card more than the real world will and as a result your graphics card will get very hot - some will climb to close to 100°C. If you hit 100°C then it would be a good idea to stop the test immediately.
Finally
Keep a note of your temperatures, the load (IE not idle) temperatures are the more useful numbers. If this guide is used as part of a support query pass them on. If you are simply playing around then you can look up the maximum temperature of what each component should be simply by doing an internet search syntax of "COMPONENT NAME max temperature" so for example of you wanted to find out the maximum temperature of a Nvidia GTX 780 you would put "Nvidia GTX 780 max temperature" into your favourite search engine search box.
You may find that Prime95 or furmark will replicate the problems you are having and inevitably case the PC to exhibit the common overheating symptoms, if that is the case then stop all tests.